Data inquiry, analysis and visualisation of climatic
conditions at spring-time
Spring Fever
Data Visualisation
Academic Work 2013
Insight
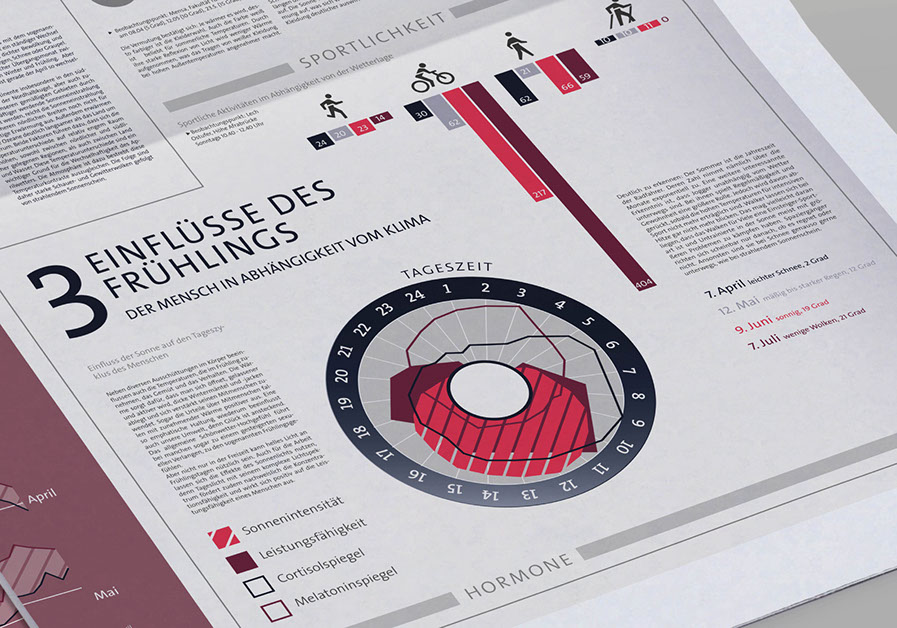
Have you ever noticed that different times of year or certain weather patterns influence how you feel or how well you sleep? In fact, people’s behaviours and routines change especially during springtime. This project collects data through research as well as it accumulates information through observation.
Idea
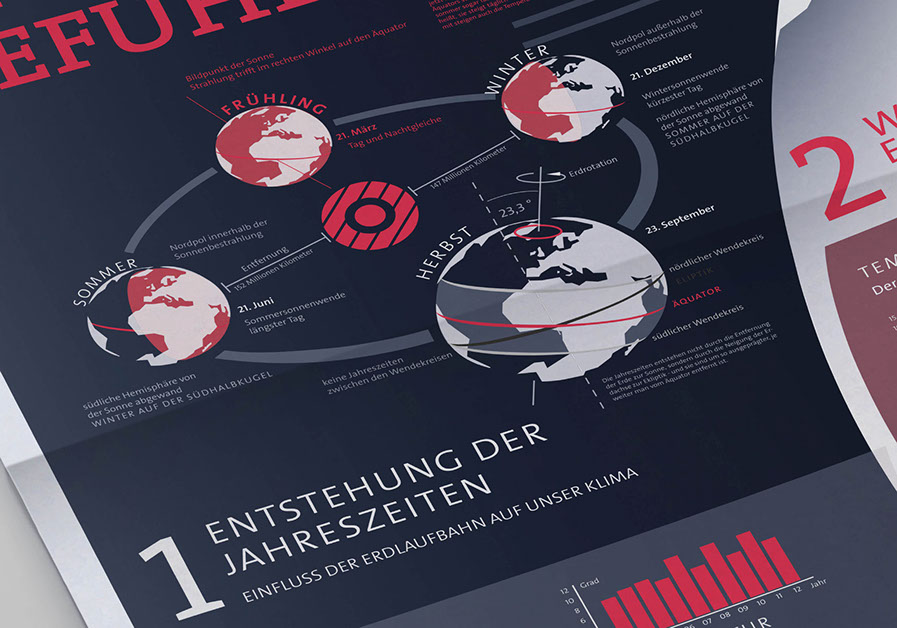
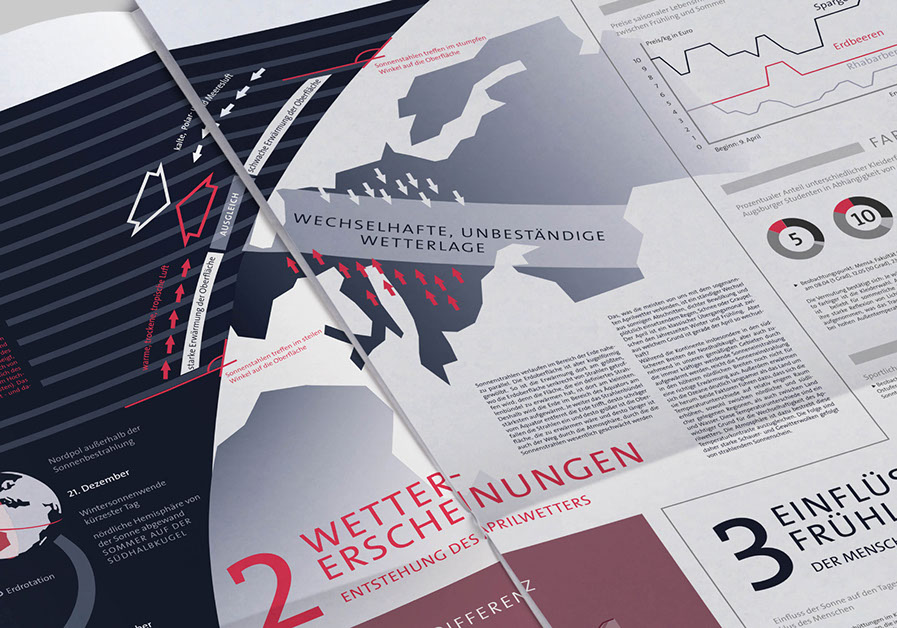
The information architecture allows you to delve deep into the subject that visualises data with all about springtime. It shows a wide range of information architecture from the formation of seasons via the explanation of weather phenomenon through to the influence of climatic conditions to human feelings and behaviour.
This project explores the design field of information architecture, – a graphic visual representation of data and knowledge. It intends to present information quickly and clearly.
Brief
browse projects
Want to see more..?
